
ClickHouse Monitoring

The best monitoring tool for ClickHouse

Query Dog is a powerful tool for ClickHouse performance optimisation. Visualise query performance and background activity, identify bottlenecks and optimise cluster performance with a single container.
https://clickhouse-monitoring
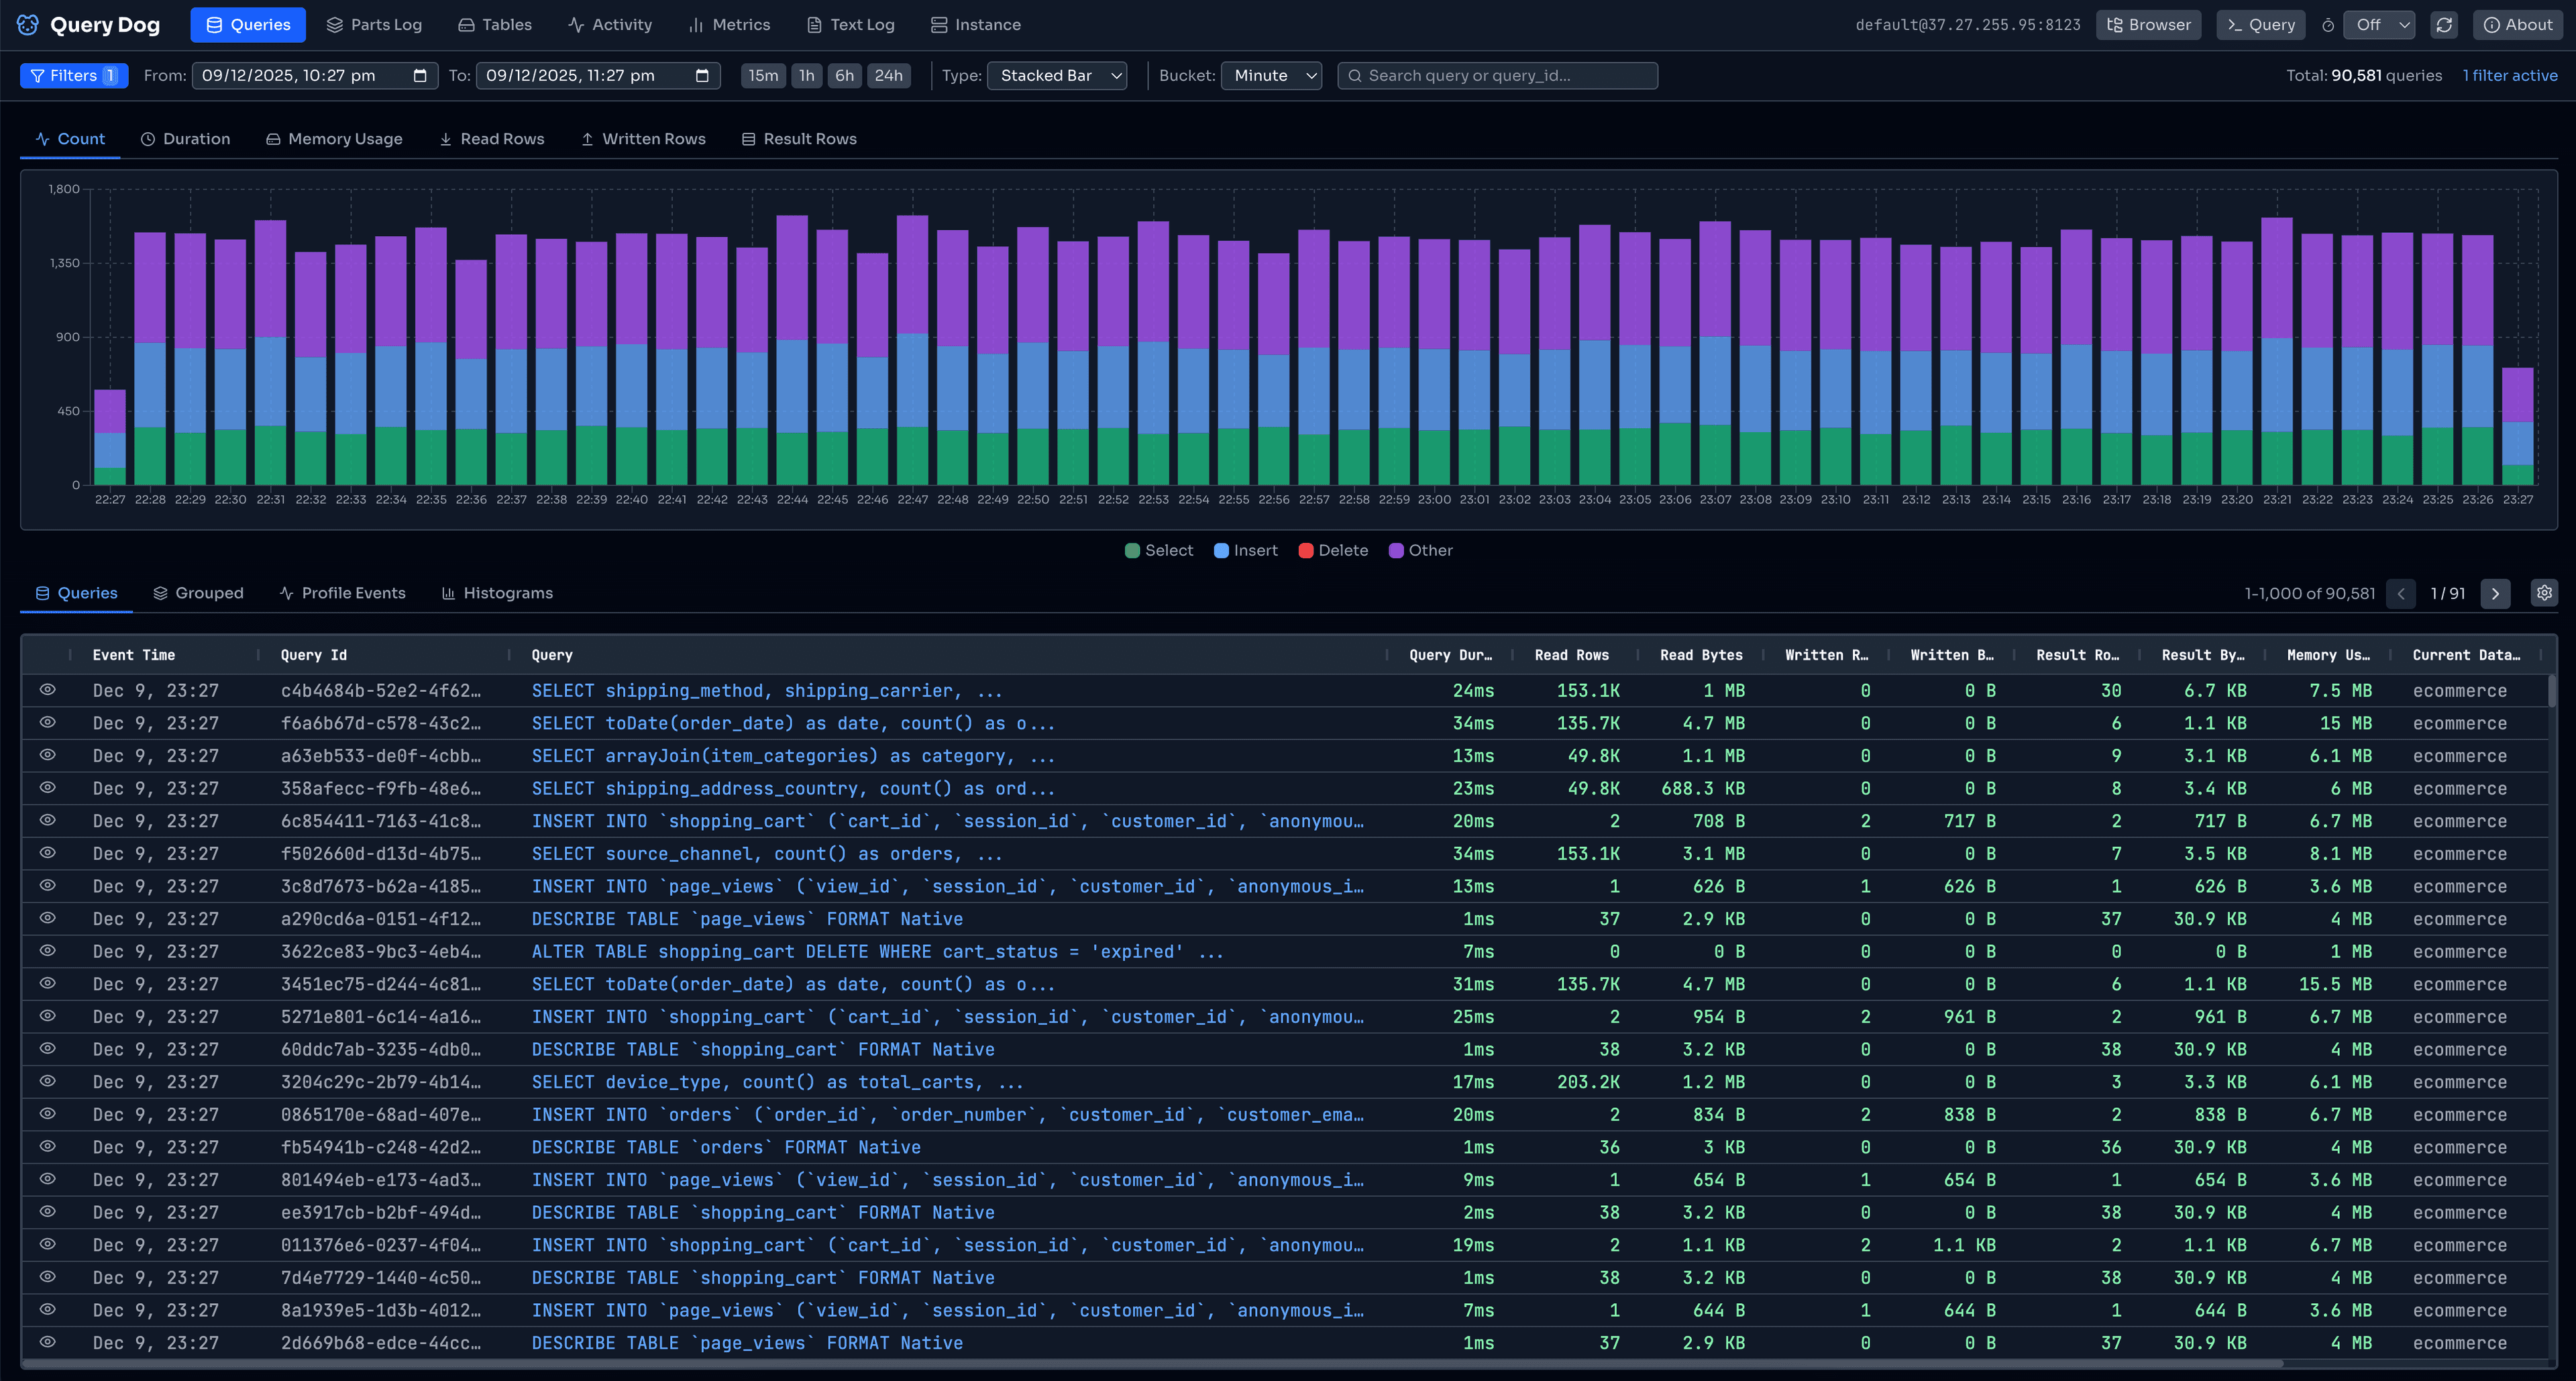
Query Dog dashboard showing query log timeline

ClickHouse is exceptionally fast, but diagnosing slow queries, resource spikes and background activity can still mean piecing together data from multiple system tables and logs. Query Dog brings those signals into one focused dashboard, giving engineering teams the visibility they need to catch bottlenecks early, troubleshoot incidents faster and keep production clusters healthy.

Key Features

Query Dog is a single container that plugs into any ClickHouse cluster, whether open source or ClickHouse Cloud, and gives your team a purpose built lens on cluster health. From query log timelines and resource profiling through to background merges, system metrics and error surfaces, it consolidates the signals you would otherwise piece together from dozens of system tables into one clear operational view.

[01]

Query log visualisation

Stop searching through system tables. Query Dog provides an intuitive timeline view of all executed queries, helping you visually spot concurrency issues and locking contention instantly.

[02]

Resource profiling

Drill down into memory and CPU usage per query. Correlate high resource consumption with specific users or query patterns to optimise cluster stability.

[03]

Background operations

Understand merge and mutation activity and how this is impacting your system and performance. Monitor part movements and background task queues.

[04]

System metrics

Track key system metrics including memory usage, disk I/O, network throughput, and thread pool utilisation to ensure optimal cluster health.

[05]

Errors and logs

Identify errors and warnings in key log files. Surface critical issues from system logs to help you troubleshoot and resolve problems quickly.

[06]

Explain plan analysis

Visualise execution plans and pipelines. Identify inefficient full table scans, poor index usage, and excessive data transfer.